
The 2020 season was the best for Indiana football in decades. Caveats about the pandemic-shortened schedule aside, the Hoosiers posted their highest winning percentage (.750) since 1967, when they split the Big Ten title and made the Rose Bowl. Starting with a miraculous overtime win over Penn State, Tom Allen's team became one of the few truly fun parts of a dour year in the sport.
Following their 14-6 win at Camp Randall Stadium, Allen's players disrupted his postgame interview to tell everyone watching that he was the "best coach in the nation," encouraging high school prospects to sign with Indiana.
That it was only about a week until National Signing Day meant there wasn't enough time for this pitch to land. Indiana's 2021 class ranked 50th in the country — not dramatically far from the program's average rank over the previous seven seasons, about 52nd.
The next fall, the Hoosiers' on-field fortunes weren't so exceptional. Their record plummeted to 2-10, the first actually bad season in Allen's generally competent tenure but the school's 17th time this century missing bowl season. They looked less like Indiana: 2020's miracle and more like... well, Indiana.
There was one place where IU saw success, though: recruiting. Allen signed four four-stars as part of the 30th-best class in the country and fifth-best in the Big Ten. It looks like the 2020 season paid off, potentially setting up a better future for the Hoosiers than their most recent results indicated.
Consider also: In December 2019, at the end of Minnesota's own best season in decades, P.J. Fleck said that the 10-2 regular season "didn't do much" for that winter's recruiting class.
Ninety-five percent of our players were committed already [by December]. What it did, though: When you win 10 games, and those players come out for College Gameday, you're able to get a Doug Emilien at the end, right, that wasn't committed. You're able to hold on to Miles Fleming when a blue blood comes after him hard.
...When you're talking through things, the brand gives you a little credibility when you're sitting in that living room of people you don't know very well.
Maybe a mediocre 2019 would have sunk the 2020 class. Having a great year, however, did not necessarily make it extraordinary by Minnesota's standards.
The following December, though, as the Gophers went 3-4? The average composite rating of Fleck's signings was the highest of his tenure. As Indiana would see a year later, there might be a delayed boost in recruiting after a big season.
These two examples made me wonder if these were isolated occurrences or something that can be seen on a larger scale. If a breakout year helps your short-term recruiting, does it have to be immediate? And how bad does a season have to be to tank your recruiting?
Before trying to answer these questions, the first thing we need to is narrow our focus.
We will only look at the Playoff era of FBS football, which began with the 2014 season. This is for a few reasons: Recruiting coverage has become more comprehensive with time. The 2000s would not have as much informative data as the 2010s do. While there was significant realignment just before the Playoff, and there will be more in the near future, membership has been stable for most conferences during the Playoff era. Lastly, the introduction of the Playoff presents a convenient cutoff point — one where we can say the game, its economics, its power structures, and even its culture were substantially different on one side of it than it has been on the other.
We will also whittle down the teams we are examining. Teams that exist in the Group of Five as it is constructed in 2022, plus independents other than BYU, will be thrown out. Many players who commit to schools in the MAC or Mountain West are not scouted as closely as prospects who go to the Big Ten or Pac-12, so the data will not be as plentiful or reliable. Fortunes also change quickly in Group of Five conferences due to coaching changes. It's more common for a successful mid-major coach to leave after a good season, disrupting any momentum the school might have built in recruiting.
As an independent, Notre Dame would stay in our sample if we weren't also removing schools that have at least once had a Blue Chip Ratio of 50 percent or greater in the Playoff era. The thinking is that an especially good season for a school with Blue Chip Ratio expectations means a level of achievement other teams cannot reach: namely a Playoff berth, or even a national championship. A school that consistently recruits well should have too high a floor to see its fortunes on Signing Day change too dramatically based on the outcomes of one season. (Clay Helton's USC aside.) The full list of Blue Chip Ratio teams we are excluding: Alabama, Auburn, Clemson, Florida, Florida State, Georgia, LSU, Miami (FL), Michigan, Notre Dame, Ohio State, Oklahoma, Oregon, Penn State, Texas, Texas A&M, UCLA, USC, and Washington.
The first way to test the relationship between winning and recruiting is straightforward: Make a scatterplot where the x-axis is a team's winning percentage, and the y-axis is their recruiting rank in a given year. To establish baselines and see how recruiting success might change over time, we'll look at four classes: the one before a given year (Y-1), the class signed the same year (Y), the class signed the following year (Y+1), and the class signed two years later (Y+2).
As an example, so this is perhaps less confusing: In 2016, Boston College went 7-6. In addition to the rank they posted the following February (2017, or Y), we want the rank of the class they signed before the season (2016, or Y-1), as well as the ranks of the classes they signed over the next two seasons (2018 and 2019, or Y+1 and Y+2).
We will do that for every non-Blue Chip Ratio Power Five team, plus BYU, for every year since the 2014 season. That gives us a sample of 368 teams in total.
A quick disclaimer, though: While we can go back in time for recruiting data, we cannot go in the future. We do not know what the data will look like for the 2023 and 2024 classes, so there are fewer teams in the sample when looking just at Y+1 and Y+2 data. Teams from the 2020 season have no Y+2 recruiting data, and teams from 2021 have no Y+1 or Y+2 data. This limits the scope of our investigation somewhat, though I believe for the most part we have enough data for this to be informative.
Anyway: Here are those four scatterplots.
 |
| Click to enlarge. |
There is not a great amount of difference between these four plots. The correlations and r-squareds for all four of them are quite close together.

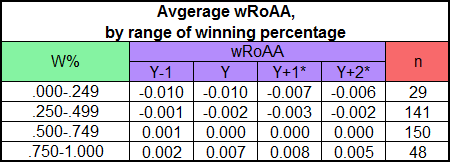
When you try to cluster these teams based on winning percentage, you can see why this is the case. Teams' average recruiting ranks over a four-year span are quite consistent. The only exception is that especially bad teams often see some recruiting gains out after bottoming out, whether due to a coaching change or regression to a mean that is typically less bad.
 |
| n = teams with a winning percentage within that row's range. Note that n is smaller for all Y+1 and Y+2 averages because we cannot measure future recruiting. |
Looking at ranks probably isn't going to be that informative.
Another option, though, is to look at ratings. Not the big, bold number 247Sports uses to rank classes every year. Using that number might be better than the ranking, but team ratings rely significantly on quantity. It's why Texas Tech had a recruiting class in the top 10 earlier this summer: Joey McGuire got players to commit earlier than most programs did.
It is true that team ratings would be more useful after classes are completed. But because a class can score higher by having more players, it's still going to contain some noise — especially when some teams have put greater emphasis on transfers than they do signing high schoolers.
I actually want to look at player ratings, as that only measures the quality of player a team signs. 247 gives an average rating for this purpose. By this metric, Alabama would have had the No. 1 class in America rather than Texas A&M.
One thing I noticed, though, was that ratings for teams in our sample started inflating around 2018.
 |
| A confession: When entering ratings into my spreadsheet, I used a 0-1 scale rather than 0-100. 247 uses a 0-1 scale for individual players but 0-100 for teams. By the time I realized this discrepancy, it was not worth the effort to correct. There is no practical difference. For the sake of consistency within this post, I will use the 0-1 scale when writing. |
Though young athletes are always getting better, recruiting ratings are not supposed to measure that improvement. That truth is supposed to be assumed — an individual prospect's rating is in relation to the rest of that year's field. We have to normalize the data somehow.
One simple way is to use each year's average rating as a baseline, finding the difference between that mark and the average rating of every recruiting class in our sample for that year. A perfectly average rating would therefore be 0 every year, rather than dealing with a shifting average that we can guess is somewhere in the mid-.800s. We'll call this metric a class' Rating over Annual Average, or RoAA. (For wider application, the "average" in RoAA would need to take into account every FBS school, not just those in our sample.) Here is the formula:
RoAA = Single-season team-specific rating - Single-season average rating of sample
Let's apply RoAA to an example before we continue working with it. The average player in Maryland's 2022 class had a rating of .868. The average player in the 2014 class had a rating of .845.
If we were just using the raw numbers, that would look like a major difference. In 2014, Maryland's class was 41st-best in the country. Michigan State, who had the same .868 rating as Maryland's 2022 class, ranked 27th. At a glance, using these numbers, it looks like Maryland's recruiting got significantly better between 2014 and 2022.
But the Terrapins' 2022 class ranked 38th. That's basically the same place in the rankings as the 2014 class. RoAA shows us why: Both years, Maryland's class rated .002 over the average class in our sample. The difference in raw rating was due to inflation, not improvement.
The following graph shows that RoAA is fairly stable as well. There has been a slight downward trend since 2014, where the average class does not drift as far from 0 in either direction as it did before, but it is not too dramatic.

Even so, we can straighten this out by weighting the data. Here is the same graph, but using Weighted Rating over Annual Average (wRoAA):

Here is how wRoAA is calculated:
wRoAA = RoAA ● Yearly weight
Yearly weight = Single-season average rating / Whole-sample average rating
In somewhat plainer English: Between 2014 and 2022, the average RoAA was .013 away from 0. That nine-year average was 1.3 times greater than that of the 2022 class, whose average RoAA was just .010 away from 0. Therefore, the RoAA of every class in 2022 needs to be multiplied by 1.3, that year's weight. After repeating the same process for every year in the sample, we have standardized the dataset so that every team's single-season RoAA — now wRoAA — is on the same scale as every other single-season wRoAA.
That was a lot to go over, so here's a brief summary of where we are:
At this point, we have advanced beyond a simple comparison of winning percentages and recruiting rankings to a metric that measures the average quality of player a team signed in a given year, and then puts all those data on the same scale.
Here, then, is a version of those four scatterplots from earlier. But instead of using recruiting rankings, the y-axis is wRoAA.

As you can see, the relationship is slightly stronger than we got from just charting winning percentages against the rankings. In particular, we see a bump in the correlations for years Y and Y+1 — suggesting that your winning percentage in one season plays a role in your recruiting success that winter and the following winter, but not much outside of that.

What's interesting, though, is that you only see that bump on the high end of the winning percentage scale.
The teams in the middle have consistent wRoAA marks year-to-year, and the teams below a .250 winning percentage actually see their wRoAA go up a small bit over time. One possible explanation: Having a particularly bad season (Y) usually leads to a coaching change, which often means an immediate dip in recruiting. Retaining a lame duck coach can have a similar effect, which would show up in Y-1. Whenever a new coach steps in (Y+1 and on), recruiting improves just by default.
But we'll test out that theory in the second part of this study.
All raw recruiting data via 247Sports.
No comments:
Post a Comment
Note: Only a member of this blog may post a comment.